Data highlight
DECEMBER 1, 2023
North Dakota’s inmigration rate in 2022 was significantly higher than the national state-to-state migration rate.
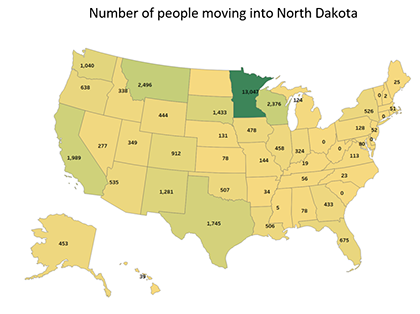
Out of 770, 498 residents one year and older in North Dakota, 122,091 moved from a different location in the past year, according to the state-to-state migration flows published by the Census Bureau based on the 2022 American Community Survey (ACS) 1-year estimates. The ACS defines moving as living in a different house or apartment one year prior to taking the survey. Out of those who moved within and into the state, 82,522 moved from a different location in North Dakota, 34,536 moved from a different state in the US, and 5,033 moved from abroad.
North Dakota’s inmigration rate — the number of people moving into the state as a share of the state’s total number of movers (28.3 percent) — was significantly higher than the national state-to-state migration rate of 19.9 percent. The largest number of people moving to North Dakota from another state were from neighboring states: Minnesota (13,047 people) and Montana (2,496 people) followed by Wisconsin (2,376), California (1,989 people) and Texas (1,745 people).
North Dakota’s outmigration rate — the number of people moving out of a state (28,359) as a share of the state’s total number of movers was 23.2 percent. Most people who left the state moved to Minnesota (10, 946 people), Texas (2,791 people), California (2,086 people), Montana (1,540 people) and Wisconsin (1,208 people).
Explore the interactive visualization
All estimates are based on a sample survey and are subject to sample variability and non-sampling error. Scroll over the visualizations to see the Margin Of Error displayed as (+/-..%). Data is considered unreliable when the error margins are greater than 70% of the estimate.
VIEW TOPIC: DEMOGRPHICS / POPULATION
NOVEMBER 1, 2023
North Dakota leads the nation in the proportion of employed individuals among the working-age population
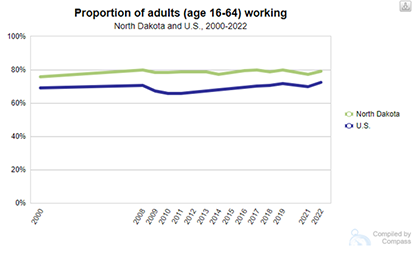
Used to evaluate the outlook of the labor market, the proportion of adults working measures the economy's ability to provide jobs for a growing population. It is derived by dividing the number of individuals (16-64 years old) who are employed by the non-institutionalized, civilian working-age population (i.e., people in both the labor force and those not in the labor force). This measure differs from the employment rate, which is calculated by dividing the number of employed persons by the number of people in the labor force. A high proportion of adults working contributes positively to the overall economy.
North Dakota has consistently outperformed the national average since 2000 in terms of its proportion of adults working. Over this timeframe, North Dakota has frequently held the top position among all 50 states, particularly in the years 2009 to 2012, 2014 to 2016, 2018, 2019, and 2022.
In 2022, 79.2 percent of the working-age population in North Dakota was employed. Males surpassed females in this regard, with 81.2 percent of males employed compared to 77.1 percent of females.
When considering age groups, individuals age 25 to 44 were the most likely to be employed, with 86.3 percent of this demographic in the workforce. They were followed by those age 45-54, of whom 84.4 percent were employed, and individuals age 20-24, with a rate of 82.7 percent. In contrast, individuals age 55-64 were less likely to be employed than those age groups previously mentioned, with a rate of 71.6 percent, and fewer than half of those age 16-19 were employed, with a rate of 47.2 percent.
Note:
The civilian population includes civilian people who are in the labor force and those not in the labor force. People on active duty in the United States Armed Forces are not included in this measure. The labor force includes those who are employed and those who are unemployed but actively seeking work. Not in the labor force include those who are retired, students, caretakers, or not pursuing employment. A person is counted as employed if they did any work during the reference period as a paid employee, worked in their own business or profession (including farming), or worked 15 or more unpaid hours a week as part of a family business or farm.
VIEW TOPIC: WORKFORCE / PROPORTION OF ADULTS WORKING
OCTOBER 1, 2023
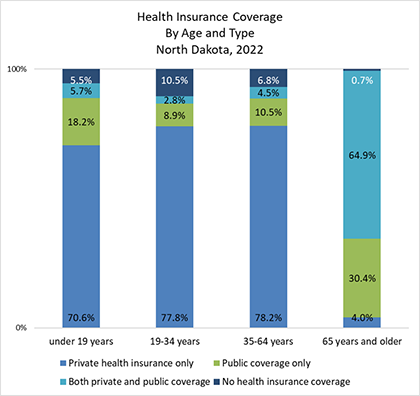
North Dakota reported the highest rate of private health insurance coverage among states in 2022.
Health insurance is the best way to ensure access to health care, it protects against financial hardship, supports preventive care, and provides a safety net if any medical issues may arise. The lack of health care coverage affects everyone in a community. Those without health insurance feel the direct physical, mental, and financial effects of not having healthcare coverage, while the insured are affected indirectly through higher health care premiums and higher taxes.
In 2022, the uninsured rate in North Dakota was 6.4 percent overall and 7.5 percent for people under 65 years old. For reporting purposes, the American Community Survey (ACS) broadly classifies health insurance coverage as private insurance or public insurance. In 2022, North Dakota reported the highest rate of private coverage among states (78.4 percent, tied with Utah) and the second lowest rate of public coverage (29.5 percent).
For people under 65 years old in North Dakota, the highest rate of coverage through private health insurance is for those 35-64 years old (78.2 percent) and the highest rate of coverage through public coverage is for those under 19 years old (18.2 percent). For older adults (age 65 and older), the situation is a little bit different. While all older adults qualify for Medicare, almost one-third of older adults in North Dakota (30.4 percent) are covered solely by a public health insurance (Medicare and Medicaid), while 64.9 percent supplement public coverage with private plans to fill the gap in coverage and pay for items such as deductibles, copayments and coinsurance. Four percent of older adults are covered by private health insurance only.
The age group with the highest uninsured rate in North Dakota are young adults, age 19-34 (10.5 percent). Some of the common factors for being uninsured among young adults are coverage gaps while transitioning from college to full-time employment, part-time employment that does not offer health insurance, perception of good health or lack of awareness of coverage options.
Data source: American Community Survey (ACS) 1-year estimates, 2022
Note:
Private health insurance is a plan provided through an employer or a union, coverage purchased directly by an individual from an insurance company or through an exchange (such as healthcare. gov), or coverage through TRICARE. Public insurance coverage includes federal programs (such as Medicare, Medicaid, and the Children’s Health Insurance Program or CHIP), individual state health plans, and CHAMPVA (Civilian Health and Medical Program at the Department of Veterans Affairs), as well as care provided by the Department of Veterans Affairs. In the ACS, people are considered insured if they were covered by any of these types of health insurance at time of interview. People are considered uninsured if they were not covered by any of these types of health insurance at time of interview or if they only had coverage through the Indian Health Service (IHS), as IHS coverage is not considered comprehensive (Health Insurance Coverage Status and Type by Geography: 2021 and 2022 (census.gov))
VIEW TOPIC: HEALTH / HEALTH CARE COVERAGE
SEPTEMBER 1, 2023
The educational attainment gap between North Dakota adults living above and below the poverty level widened since 2017 – with fewer adults below poverty now having at least a bachelor’s degree.
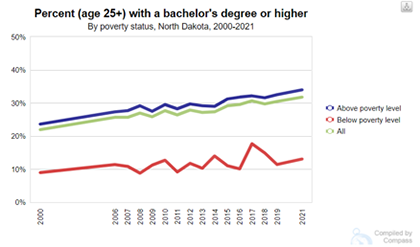
Since 2000, North Dakota’s percentage of adults (age 25 and older) holding a bachelor’s degree or higher has been slightly below the national average. In 2021, North Dakota ranked 33rd among the 50 states (rank of 1 is highest percent in U.S.), with 31.7 percent of adults holding at least a bachelor’s degree (compared to 35.0 percent nationally).
Educational attainment is not equal among all adults (age 25 and older). When examining those with a bachelor’s degree or higher, a difference exists by adults’ poverty status in North Dakota. While 1 in 3 adults (33.9%) who live above the poverty level held a bachelor’s degree or higher, about 1 in 8 adults (13.1%) below the poverty level held this education level. There has always been a gap in educational attainment by poverty status in North Dakota, but the gap increased since 2017, a year that registered the highest percent of adults in poverty with a bachelor’s degree or higher.). The percentage of adults below poverty that have a bachelor’s degree or higher decreased from 17.6 percent in 2017 to 13.1 percent in 2021, while the percentage of those above the poverty level increased from 32.2 percent to 33.9 percent during the same time period.
VIEW TOPIC: WORKFORCE / EDUCATIONAL ATTAINMENT
AUGUST 1, 2023
Share of North Dakotans who moved in the previous year lowest in the past 10 years.
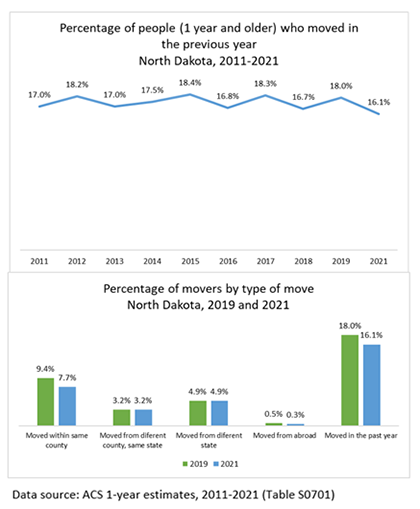
The percentage of North Dakota residents, ages one year and older, who moved in the previous year fluctuated during the past 10 years with highest percentage at 18.4 percent in 2015 and lowest at 16.1 percent in 2021, according to the American Community Survey (ACS) 1-year estimates.
The ACS defines moving as living in a different house or apartment one year prior to taking the survey. In 2021, about 123,107 people moved in North Dakota, down from 135,090 in 2019. Moves are classified by the type of geography which people move to and from: within same county, from a different county in the same state, from a different state, or from abroad.
- Moves within the same county in North Dakota were the most common type of moves. In 2019, 9.4 percent of North Dakota’s population ages one year or older moved to a new residence in the same county; by 2021, that percentage had declined to 7.7 percent.
- The percentage of those who reported that they had moved the previous year to a new residence in a different county within North Dakota stayed the same between 2019 and 2021 (3.2%).
- Movers to a new residence in North Dakota from a different state also stayed the same from 2019 to 2021 (4.9%).
- The percentage of movers from abroad declined slightly from 0.5 percent to 0.3 percent during this time period.
July 1, 2023
While still young compared to most U.S. states, North Dakota and most of its counties are getting older.
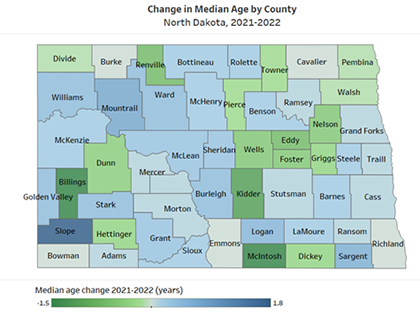
With a median age 35.8 years in 2022, North Dakota is 3.1 years younger than the U.S. (median age 38.9 years), according to Vintage 2022 Population Estimates recently released by the U.S. Census Bureau. While North Dakota still looks fairly young overall, in 2022, the median age at the county level greatly varies, ranging from 28.0 (Sioux County) to 54.4 years (Sheridan County). Out of the 53 counties, 43 have a median age older than the state (35.8 years), 39 counties have a median age older than the nation (38.9 years) and seven of those counties have a median age older than 50 years.
When comparing median age by county (July 1st, 2022 to July 1st, 2021) out of the 53 North Dakota counties, 17 decreased their median age, five stayed the same, and 31 increased their median age. The largest decrease in median age was observed in Billings County and McIntosh County (-1.5 years each), and Kidder County (-1.1 years). The largest increase in median age was observed in Slope County (+1.8 years) and Mountrail County (+0.7 years).
Out of the seven oldest counties in North Dakota with a median age over 50 years (Sheridan, Grant, Slope, McIntosh, Wells, Emmons, and Griggs), three became younger from 2021 to 2022 (Griggs, Wells, and McIntosh), Emmons stayed the same, while Grant, Sheridan and especially Slope continued to increase their median age.
VIEW TOPIC: DEMOGRAPHICS / AGE
June 1, 2023
Nearly all North Dakota industries gain jobs in 2022.
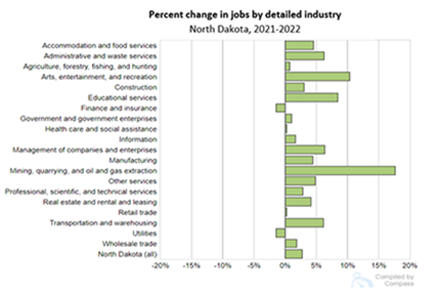
Like all other states, the North Dakota job market was impacted by the COVID-19 pandemic, suffering a 6.3 percent decline or a loss of 26,838 jobs from 2019 to 2020. However, from 2020 to 2021, North Dakota jobs slowly started to come back and increased by 1.1 percent (4,484 jobs). In 2022, North Dakota continued the positive trend and gained 10,836 jobs overall, a 2.7 percent increase compared to the previous year.
Looking specifically at percent change in jobs by industry, in North Dakota in 2022, the Mining, Quarrying, and Oil and Gas Extraction industry had the largest percentage increase of all industries from the previous year, increasing jobs by 17.6 percent and gaining 2,421 jobs. The Arts, Entertainment, and Recreation industry increased jobs by 10.3 percent and gained 559 jobs from the previous year, followed by the Educational Services industry, which increased by 8.4 percent and gained 244 jobs from 2021. Although nearly all North Dakota industries show improvement in the number of jobs from 2021 to 2022, Finance and Insurance industry lost 250 jobs and Utilities industry lost 49 jobs (1.5 percent decrease each).
Note: Employment and wages by industry are compiled using results from quarterly unemployment insurance contribution reports and disseminated through the Quarterly Census of Employment and Wages (QCEW) program—a near-census count of all the state’s employers and jobs and considered the most accurate source for detailed employment and wage information by industry. Data are limited to those workers who are covered by either state or federal unemployment insurance laws. There are a few select groups that are exempt from this coverage. They include self-employed (farm and nonfarm sectors); individuals working for religious organizations; students working for the college they attend; individuals employed in church-related elementary and secondary schools; and individuals working for railroads.
May 1, 2023
Effects of births, deaths, and migration on the population of North Dakota counties.
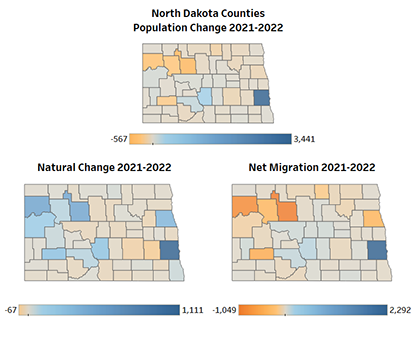
From July 2021 to July 2022, North Dakota’s population increased by 1,327 people overall. According to the most recent population estimates released by the Census Bureau, Cass County leads North Dakota counties in population increase by adding 3,441 residents during this time period. Burleigh County followed Cass County in population gain with an addition of 313 people and Morton County added 150 people. Another 11 counties gained population in addition to the three mentioned. The remaining 39 counties lost population, with Rolette, Stark, Mountrail, Williams and Ward counties losing at least 150 people each. Ward County had the largest decrease, with a loss of 567 people.
The combination of births and deaths (natural change) and migration provides insight into how the population is changing over time. From 2021 to 2022, counties that led in population gains overall, also led in gains from net migration. Cass County gained an additional 2,292 people, Burleigh 130 and Morton 97 by more people moving into than moving out of the county. Conversely, counties that led in population loss overall, many of which are in the western part of the state, lost the most population due to outmigration. However, in addition to the metropolitan areas in the state, counties largely in the western part of the state, are among the counties with the largest population increase due to natural change with more births than deaths. Both trends, loss due to outmigration and growth due to more births than deaths in western North Dakota, are mainly related to energy development activities that attracted young people and families during the oil boom and later led to outmigration due to the downturn in the oil and gas industry.
Color legend:
The darker the blue the largest the population gain
The darker the orange, the largest the population loss
Source: U.S. Census Bureau, Population and Housing Unit Estimates, Vintage 2022 Estimates
VIEW TOPIC: DEMOGRAPHICS / POPULATION
April 1, 2023
Adult obesity rate increased in all North Dakota Counties from 2010 to 2020.
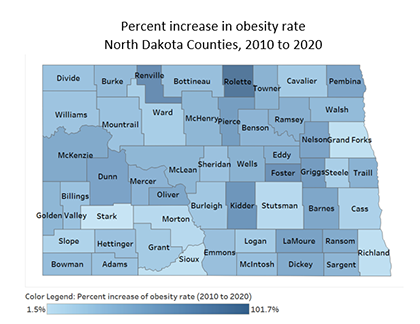
Obesity is a common, serious, and costly chronic disease that increases the likelihood of diabetes, cardiovascular disease, some forms of cancer, hypertension, and other chronic diseases. An adult is considered obese if their Body Mass Index, calculated using a person’s height and weight, is greater or equal to 30 kg/m2.
The rate of obesity among adults in North Dakota has been gradually increasing at the state and county level. From 2010 to 2020, obesity rates in adults, age 20 and older, increased in all North Dakota counties. While in 2010, obesity rates at the county level ranged from 17 percent (lowest) to 30 percent (highest), in 2020, obesity rates ranged from 21 percent (lowest) to 48 percent (highest).
Rolette County, the county with the highest obesity rate in 2020, doubled its obesity rate from 24 percent in 2010 to 48 percent in 2020. In addition to Rolette, 15 more counties increased their adult obesity rate by more than 50 percent. Four counties (Stark, Grand Forks, Sioux, and Richland) only slightly increased their adult obesity rate, by less than 10 percent.
VIEW TOPIC: HEALTH / OBESITY
March 1, 2023
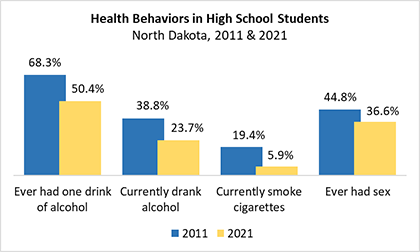
Some unhealthy behaviors decreased among North Dakota high school students in the past decade
Health behaviors are actions individuals take that affect their health. They include actions that lead to improved health, such as eating well and being physically active, and actions that increase the risk of health problems, such as excessive alcohol intake, smoking, and risky sexual behavior.
The use and/or abuse of substances, such as alcohol, tobacco, and other drugs, by children and youth poses health and safety risks to them, their families, their schools, and their communities. Substance use and abuse can increase the risk for injuries, violence, HIV infection, as well as other diseases.
According to the Youth Risk Behavior Survey (YRBS) administered to high school and middle school students throughout the U.S., the percentage of high schoolers in North Dakota who ever had one drink of alcohol in their life decreased substantially from 68 percent in 2011 to 50 percent in 2021. Similarly, the percentage of high schoolers who currently drink alcohol (at least one drink of alcohol, on at least one day during the past month) decreased from 39 percent in 2011 to 24 percent in 2021. The survey for binge drinking slightly changed in 2017 and does not allow direct comparison with previous years. However, the past three years show decrease in the percentage of high school students in North Dakota who were binge drinking in the past 30 days from 16 percent to 14 percent.
According to the 2021 YRBS, 6 percent of high school students in North Dakota reported currently smoking cigarettes (at least one day in the past month), down from 19 percent in 2011. However, in 2021, 21 percent of high school students reported currently using an electronic vapor product (at least one day during the past month).
Many young people engage in sexual behaviors that can result in adverse health outcomes, such as unintended pregnancy and Sexually Transmitted Diseases, including HIV. The proportion of high school students who ever had sex decreased from 45 percent in 2011 to 37 percent in 2021.
VIEW TOPIC: CHILDREN & YOUTH/YOUTH USE OF ALCOHOL/YOUTH SEXUAL ACTIVITY
February 1, 2023
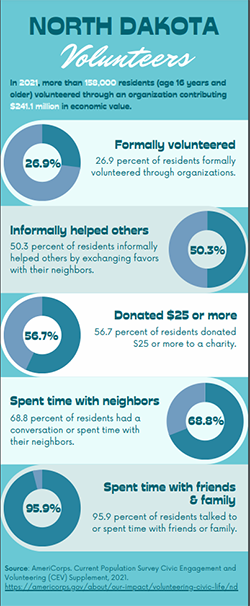
More than one in four North Dakotans (age 16 years and older) formally volunteered in the midst of the pandemic, in 2021
Volunteering is a form of civic engagement that brings significant benefits to individuals and communities. Volunteers are important community assets, helping to enrich the lives of those they serve and often providing care and services that neither government nor the private sector can afford to provide on their own.
The recently released 2021 Current Population Survey Civic Engagement and Volunteering Supplement, developed by U.S. Census Bureau and AmeriCorps, collected data on volunteering and other civic behaviors in the midst of the COVID-19 pandemic, from September 2020 to September 2021. Comprehensive research about civic engagement trends in the U.S. is produced every two years.
According to the survey, an estimated 26.9 percent of North Dakotans (age 16 years or older) or 158,017 people formally volunteered with organizations between September 2020 and September 2021. In total, these volunteers served an estimated 8.6 million hours of service with an economic value of $241.1 million. For comparison, although North Dakotans volunteer at a higher rate than the U.S. (23.2%), residents in neighboring states of Minnesota, South Dakota, and Montana volunteered in higher rates than North Dakota (35.5%, 34.2%, and 31.1%, respectively). Formal volunteering involves helping others through organizations and includes activities like public health efforts, conducting wellness checks on isolated seniors, supporting food banks, and providing virtual tutoring and mentoring to help students stay on track in school.
In addition to formal volunteering, the survey also collected data on informal helping others outside of an organizational context, including spending time or doing favors for neighbors or spending time with family and friends. In North Dakota, more than 273,000 people (50 percent of residents age 16 years or older) informally helped their neighbors during the pandemic in 2021.
Find more details in the infographic and on the AmeriCorps website.
Data source: AmeriCorps. Current Population Survey Civic Engagement and Volunteering (CEV) Supplement, 2021. Analytical version. Washington, DC: U.S. Census Bureau [producer]. Washington, DC: AmeriCorps Office of Research and Evaluation [producer and distributor].
VIEW TOPIC:CIVIC ENGAGEMENT/VOLUNTEERISM
january 1, 2023
North Dakota’s population bounces back in 2022
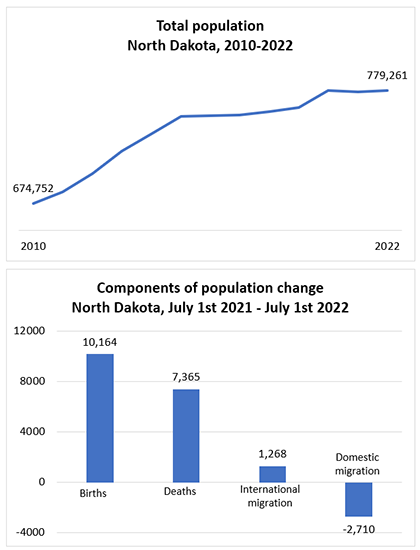
U.S. Census Bureau’s population estimates as of July 1st, 2022 (779,261 people), show an increase of 1,327 people in North Dakota’s population from July 1st, 2021. This small increase in population comes after a slight decline in the previous year (loss of 1,584 people according to the most recent population estimate). However, in the previous decade North Dakota witnessed tremendous population growth from 2010 to 2015 and steady growth from 2016 to 2020.
A look at the components of change reveal some insight into North Dakota’s population change.
North Dakota had 10,164 births and 7,365 deaths from July 1st, 2021 to July 1st, 2022. The natural change (births minus deaths) was larger in 2022 as compared to 2021 (2,799 natural change in 2022 as compared to 2,242 in 2021). This is due to a slightly higher number of births and a decrease in the number of deaths as compared to the previous year.
Another component of population change is the net migration calculated as the number of people who enter the state (in-migration) minus the number of people who leave the state (out-migration). From July 1st, 2021 to July 1st, 2022, North Dakota experienced a larger number of people leaving than entering the state, a negative net migration of 1,442 residents. The negative net migration is due to domestic out-migration (-2,710 people) and international in-migration (1,268 people). These changes reflect a slight recovery after the COVID-19 pandemic that impacted all components of population change in 2021.
Source: U.S. Census Bureau, Population and Housing Unit Estimates, Vintage 2022 Estimates
Note:
The Population Estimates Program uses current data on births, deaths and migration to calculate population change since the most recent decennial census date and produce a time series of estimates of population, demographic components of change, and housing units.
The Vintage 2022 release contains annual estimates for 2021 and 2022 but is not comparable to previous releases due to recent changes in how migration is estimated.
VIEW TOPIC:DEMOGRAPHICS/POPULATION
Center for Social Research
North Dakota State University
Compass created by:
Wilder Research
© 2024. All rights reserved.